A hazard map can look definitive: a coloured line separates one zone from another, giving buyers, councils and insurers something concrete to point at. Yet risk is not a fixed colour. It is the interaction between a physical event, the people and assets exposed to it, their vulnerability, the reliability of protective infrastructure and the time horizon used for decisions.
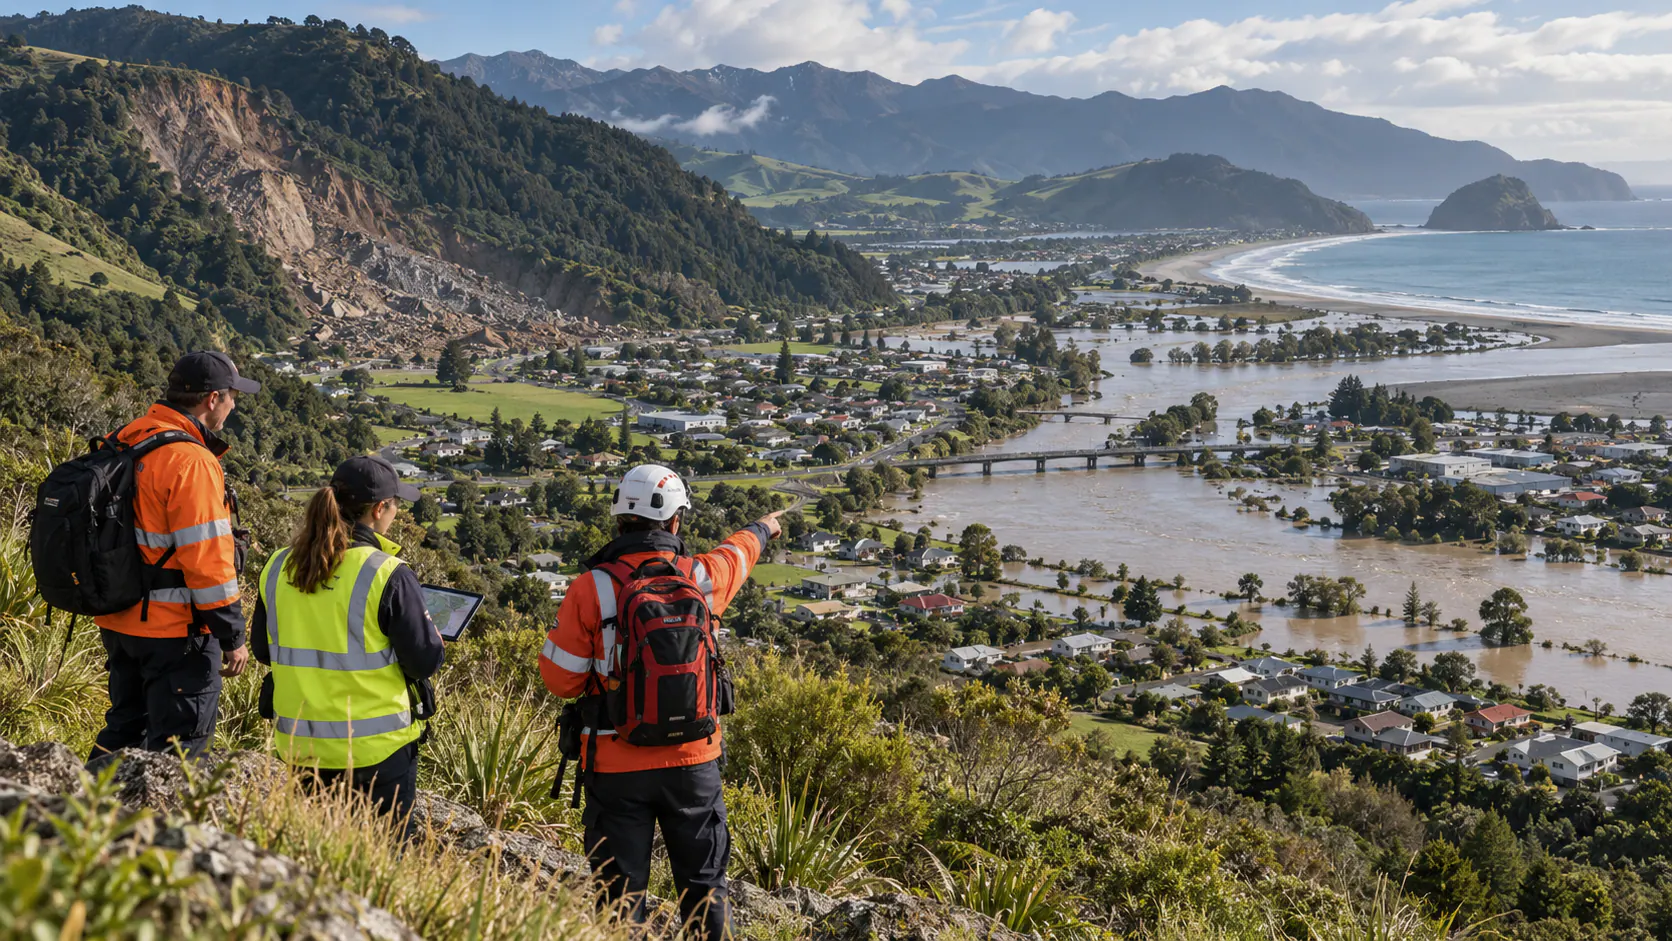
New Zealand faces earthquakes, volcanic activity, tsunami, floods, landslides, wildfire and coastal change. These hazards are studied by different institutions and expressed through different planning, building and emergency systems. The practical challenge is to connect them without creating a single false number that hides important differences.
Hazard is not the same as risk
A flood depth estimate describes a physical possibility. Risk also asks who lives there, whether evacuation is possible, what a power outage would affect and how quickly households can recover. Maps should state clearly which part of that chain they represent.
Time changes the picture
Earthquake probabilities, river modelling and coastal scenarios use different horizons. A house, road, hospital and temporary event each have different design lives. Decisions need explicit timeframes rather than an unexplained boundary presented as permanent truth.
Uncertainty should be visible
Models depend on terrain data, rainfall assumptions, fault behaviour and engineering performance. Publishing ranges and update dates helps users understand uncertainty. Hiding it behind a crisp line creates surprise and conflict when the map changes.
Infrastructure creates shared consequences
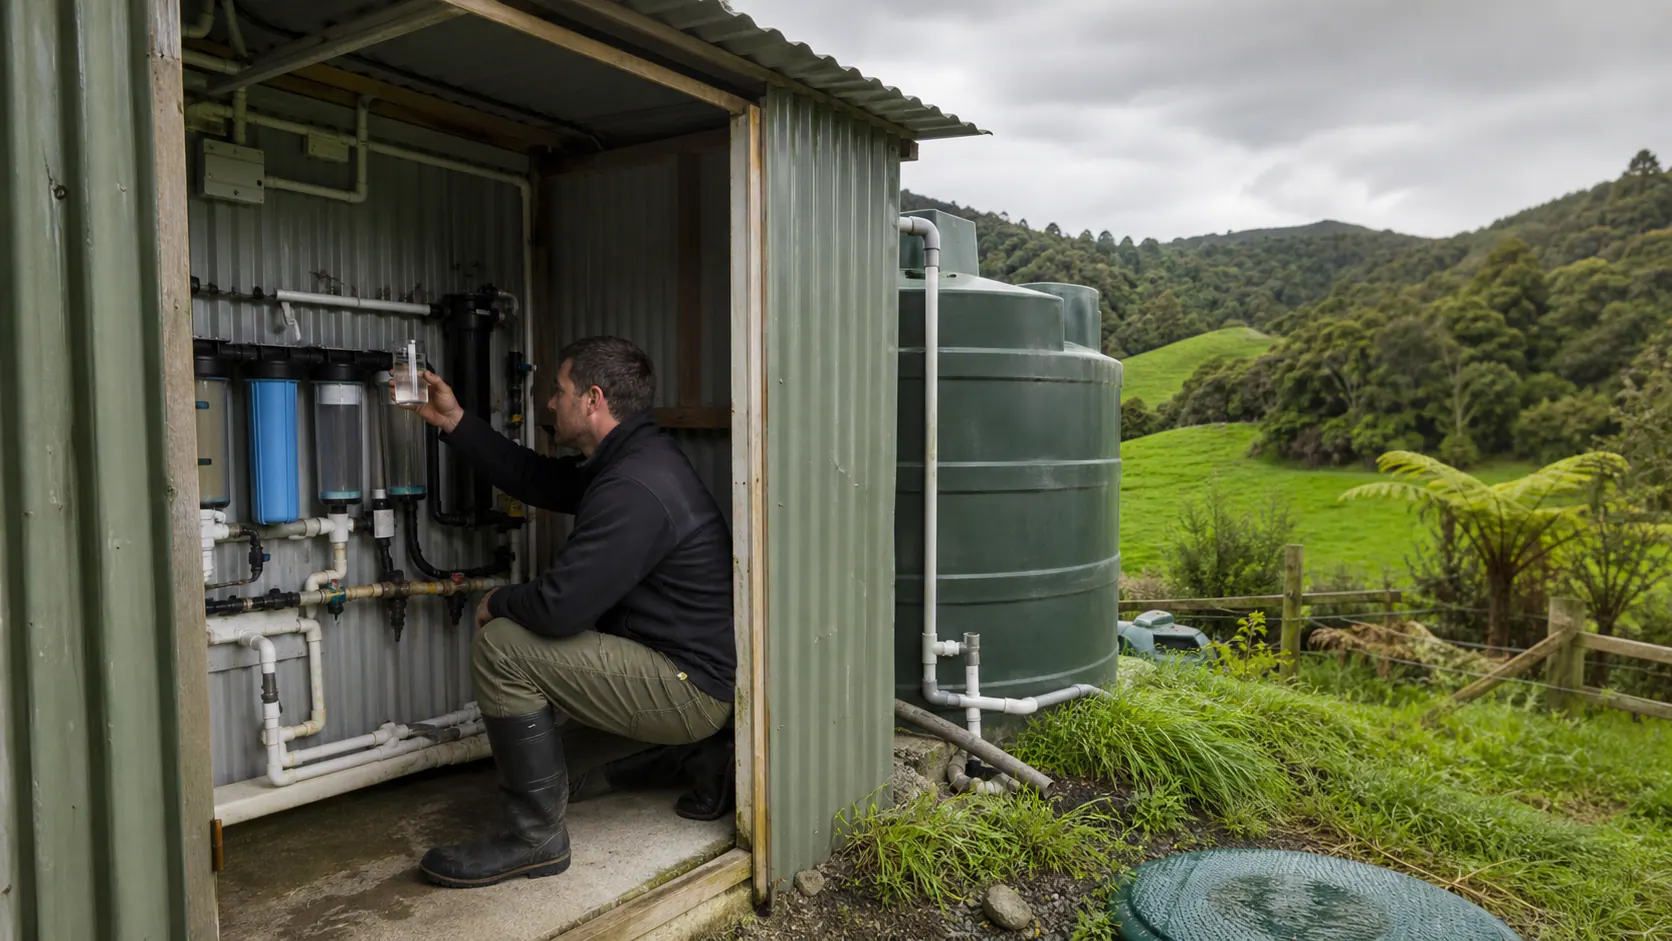
A property outside a mapped zone can still lose water, access or electricity when a bridge, substation or treatment plant fails. Lifeline networks require corridor and dependency analysis, not parcel-by-parcel thinking.
Mātauranga and local experience add evidence
Communities remember past inundation, slips, springs and evacuation barriers that national datasets may miss. Local knowledge should be documented and tested alongside technical modelling, with appropriate authority and attribution.
Disclosure must support action
Telling a household about risk without providing usable advice, finance or pathways can simply reduce confidence and value. Information should connect to building measures, insurance guidance, emergency plans and long-term adaptation choices.
Avoid shifting risk to the least resourced
Retreat, strengthening and higher premiums affect renters, low-income owners and Māori land differently. Equity analysis is not an optional social appendix; it determines whether a policy can be implemented without deepening vulnerability.
Build a living national framework
New Zealand needs common definitions, interoperable data, transparent model versions and clear roles for updates, while preserving hazard-specific expertise. The goal is not one master map. It is a system in which different maps can be understood together and revised without public trust collapsing.